Replay Node 26
We're excited to announce that Replay Node is now generally available, and based on Node 26!
Replay Node is our time-travel-enabled version of Node. As with our version of Chromium, it enables you to make time-travel recordings that fully capture runtime behavior, and unlocks the power of time-travel debugging via agents with Replay MCP (or humans using the Replay DevTools UI).
Replay Node 26 Support
We previously had an early alpha of Node recording support, based on Node 16. It did make recordings, and our own Mateusz Burzyński actually used it to debug the TypeScript compiler's internals. But, Node 16 is very outdated (most modern frameworks expect Node 18 or 20+), and the recording runtime didn't have any of our recent stability improvements to V8.
We've successfully rebuilt the recording runtime capabilities on top of Node 26. This means it has full support for modern Node capabilities, including running TypeScript files directly through Node's built-in type stripping.
Going forward, Replay Node will continue to track the current Node release (so no separate older builds for Node 22 or 24).
Replay Node Supported Environments
For now, Replay Node 26 only runs on Linux x86-64. There's no Windows build, and the macOS download still gives you the old Node 16 runtime. We'll look at enabling Mac build support in the near future.
Using Replay Node
Installation
Install the @replayio/node package globally:
npm i -g @replayio/node
That gives you the replay-node command. The first run downloads the runtime into ~/.replay/node/node.
If you installed Replay Node before, you'll need to update from the legacy Node 16 runtime since replay-node doesn't check for new versions on its own. Run this once:
replay-node --update
After that, replay-node works like node: replay-node script.js (or script.ts) runs the script and saves one recording when the process exits.
Example: recording a Next.js server
Node is commonly used as a server platform. Here's an example of how Replay Node can help debug a server process.
Back in April, I wrote about using Replay MCP to debug the bugs in Nadia Makarevich's Next.js example app. Those recordings only covered the browser. This time I recorded the Next.js server.
Build the app with your normal Node, then start the production server under Replay Node:
npm run build
replay-node --exec ./node_modules/.bin/next start -p 3457
--exec puts Replay Node first on your PATH and runs the command, so any Node process it starts gets recorded. For next start that's one process, so you get one recording for the whole server run.
For this example, I loaded /users once in a browser. That one page load called the app's sendAnalyticsData Server Action five times (which turns out to be part of one of Nadia's bugs - more on that in the next post). Then I hit Ctrl+C to stop the server, and Replay Node finished writing the recording.
Note that pages Next prerenders at build time never run in the server you're recording, so their code won't show up. In Nadia's app, I made /users render per request so that its redirect runs in the recorded server.
next dev works too. It starts several Node processes, so each one becomes its own recording. The one you want is the process that handles requests (start-server.js). When you stop the dev server, Next kills that process 100ms after asking it to exit, which isn't enough time to finish writing the recording, so raise the timeout:
NEXT_EXIT_TIMEOUT_MS=30000 replay-node --exec ./node_modules/.bin/next dev
Upload
Once you’ve got a recording, you can upload it with the Replay CLI:
replayio upload
replayio list shows local recordings. The upload also sends the source maps Next generated, so both the dev and prod server recordings can show your original TypeScript files instead of the compiled server bundle.
Debugging the Recording
Once you've got a recording uploaded, you can hand it to your agent to debug via the Replay MCP server. Set up and connect Replay MCP with your agent of choice (Claude Code, Codex, OpenCode, or another MCP client), then give it the recording ID and ask it to investigate.
Most agents start with the RecordingOverview tool. For a Node recording, it now detects the framework and summarizes what the server did. Here's part of the overview for this recording:
- Node.js v26.13.1 server recording
- **Command:** `next start -p 3457`
- **Framework:** Next.js 16.1.6 (production, `next start`)

## Requests Handled (Next.js)

| Method | Route | Count | Kind |
| --- | --- | --- | --- |
| POST | `/users`, `/users/1` | 5 | server action `sendAnalyticsData` |
| GET | `/api/user` | 1 | route handler |
| GET | `/users` | 1 | page |
| GET | `/users/1` | 1 | page |

Entry points that ran:
- `sendAnalyticsData` src/actions/analytics.ts:4 — server action, 5 calls
- `GET` src/app/api/user/route.ts:11 — route handler for /api/user, 1 call
- `UsersPage` src/app/users/page.tsx:7 — page for /users, 1 call
- `RootLayout` src/app/layout.tsx:21 — layout for /, 2 calls
- `RootLayout` src/app/users/layout.tsx:8 — layout for /users, 2 calls
That already answers the first question. From there, the agent can set a logpoint inside the action and get back the arguments for every call. Here's what the Logpoint tool returns for name on line 4 of src/actions/analytics.ts:
Found 5 total hits at src/actions/analytics.ts:4
Hit 1 at point Point:2 @ 10134.50ms:  Expression: name  Result: "root-layout"
Hit 2 at point Point:3 @ 10586.83ms:  Expression: name  Result: "users-layout"
Hit 3 at point Point:4 @ 11075.93ms:  Expression: name  Result: "root-layout"
Hit 4 at point Point:5 @ 11143.93ms:  Expression: name  Result: "users-layout"
Hit 5 at point Point:6 @ 11743.96ms:  Expression: name  Result: "user-profile"
The root layout and the users layout each sent their analytics twice, and the user profile sent it once.
"Where was it called from?" has an interesting answer on the server side. The GetStack tool shows the action was called by Next's Server Action handler:
Call stack:
0. c     at file:///.../src/actions/analytics.ts:4:2
1. (anonymous)     at webpack://next/src/server/app-render/action-handler.ts:1223:13
2. rH     at file:///.../next/dist/compiled/next-server/app-page-turbo.runtime.prod.js:16:1989
That's accurate: from the server's point of view, each call started as a POST request from the browser. The name argument tells you which component sent it, but why the layouts sent it twice is a question for the browser recording. That's what the next post is about.
This action happens to log its name argument, so you could have found the five names in the server output. But you can ask the recording about values nobody logged. For example, here's a logpoint on the redirect() line in src/app/users/page.tsx, showing the user object the page redirected with:
Found 1 total hit at src/app/users/page.tsx:10
Hit 1 at point Point:7 @ 9591.52ms:
Expression: JSON.stringify(user)
Result: "{\"id\":1,\"name\":\"John Doe\",\"email\":\"john.doe@example.com\",\"department\":\"Engineering\",\"avatarUrl\":null,\"role\":\"admin\",\"joinedAt\":\"2023-03-15T09:00:00Z\",\"lastLoginAt\":\"2024-01-28T14:32:00Z\"}"
None of that was logged by the app. Time-travel debugging lets us inspect what happened after the fact, in as much detail as we need, without restarting the server, adding logging, and trying to reproduce the request.
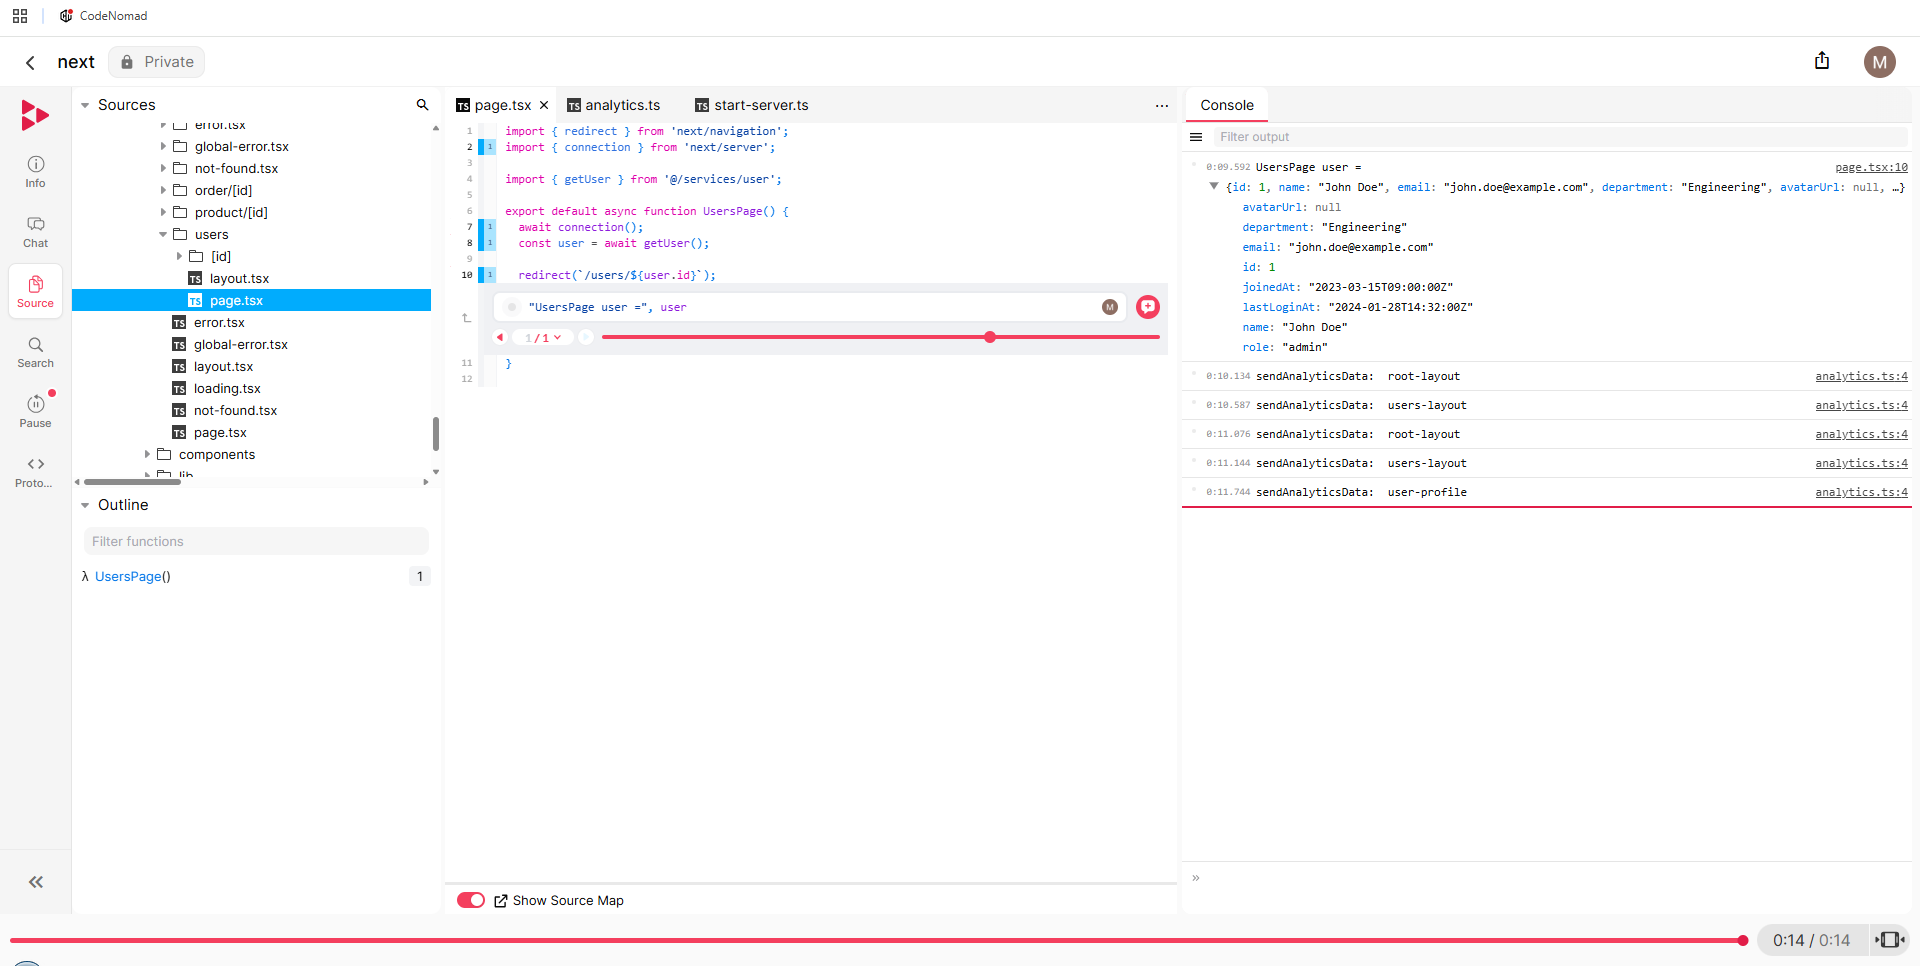
If you'd like to investigate yourself, you can open the recording in the Replay DevTools UI. You can open any of the server's source files and see how many times each line ran, step through any of those calls, check variable values, and add print statements after the fact to see what a line would have logged every time it ran.
Here I've added a print statement on the redirect() line in src/app/users/page.tsx, and another one in the sendAnalyticsData action. The console shows the full user object from the redirect, followed by all five analytics calls in order:
What's next
Replay recordings of a browser have always been incredibly valuable for debugging. But, a lot of the bugs that show up in the browser actually start on the server, or happen because client and server disagree on what should happen. In the next post, I'll go back to Nadia's app, and we'll see what happens when an agent has both a browser and a server recording for each bug available to use in its investigation.
In the meantime, install Replay Node, record something, and tell us what breaks in Discord. The full setup is on the Replay Node docs page.