Replay Time Travelogue: Revisiting Nadia’s Next.js bugs, with server recording
Back in April, I wrote a couple of posts about using Replay MCP to debug the bugs in Nadia Makarevich’s Next.js example app. Those investigations all used recordings of only the browser. Thanks to Replay MCP, the agent could see every render, every network request, and every line of client code that ran. But, the server was a black box - all the agent could see was the responses that came back.
Most user-facing bugs in a real web app involve both sides. The browser sends a request, the server does something with it, and the browser does something with the response. If you only have one side, you end up guessing about the other one, and so does your agent.
Now that Replay Node is updated to Node 26, we can record the Next.js server as well. So, I went back to the same app and the same bugs, recorded both the browser and the server, and gave both recordings to an agent.
I expected the server recording to make the agent noticeably better at solving these bugs. It didn’t, mostly because the agent was already very good at them :) But, it did change what the agent could actually verify and prove, it made checking a fix much stronger, and it taught us a lot about how agents use our tools.
Background: Nadia’s App and the April Results
Nadia is the author of Advanced React and writes at Developer Way. Earlier this year she wrote “Debugging with AI: Can It Replace an Experienced Developer?”, where she built a small Next.js app with some deliberately tricky bugs, and checked how well an agent could find and fix them from the code alone. Her conclusion was that agents could do some debugging, but struggled with nailing deeper root causes, especially when both client and server were involved. Thanks to Nadia for writing that up and publishing the code - it continues to be a great test case!
Two of her bugs matter for this post:
- Bug 2: the user page flashes two different loading skeletons in a row. First the route’s
loading.tsxskeleton, then the page’s ownUserPageSkeleton, and then the actual content. - Bug 3: loading
/usersdirectly crashes with “Application error: a client-side exception has occurred”, which is a minified React error #310 (“Rendered more hooks than during the previous render”).
Both of these have a server side. Bug 2 happens because the server renders the user page without fetching the user’s data, so the client has to fetch it after hydration. Bug 3 is a race between the redirect on /users and a Server Action that two layouts fire from a mount effect.
What’s Changed Since April
For my April posts, I tried to do some mostly-scientific experimentation. I did multiple runs of the same scenarios, and tried varying the prompts to see how the results changed. Later prompts added more detailed investigation process instructions, and included skill contents for Next.js and TanStack Query. Those definitely helped.
Before adding the server, I wanted a fair baseline. A lot has changed in the last seven months: newer models, my own harness setup, and Replay MCP itself. My own local agent setup now uses Opus 5.5 instead of 4.6, I upgraded from OpenCode 1.x to 2.x, and I’ve improved the list of file search tools I have available. I’ve also shipped numerous improvements to Replay MCP’s tools. For example, the NetworkRequest tool now labels Server Action requests as server action: sendAnalyticsData, instead of showing a plain fetch. So, I re-ran the April prompts against the April browser recordings with Opus 5.5 to see how the results compared with the newer setup.
On bug 2, all three runs scored 12/12 in 2.1–2.4 minutes, versus 6.4 minutes for April’s best run. On bug 3, all three runs scored 6/7 in 2.2–2.6 minutes, versus 9.1 minutes for April’s best run (which got 7/7). A lot of April’s extra time turned out to be harness overhead (MCP timeouts and context compression), rather than the agent itself being slower. Either way, the baseline is high: browser recordings alone get an agent most of the way on both bugs in about two minutes.
Recording Both Sides
The browser side is the same as before: load the page that shows the bug in Replay Chrome.
For the server side, I used the same setup as in the Replay Node 26 post: build the app with your normal Node, then run next start under Replay Node:
npm run build
replay-node --exec ./node_modules/.bin/next start -p 3457
That gives you one recording for the whole server run. The server’s source maps resolve to the original TypeScript (including Next’s own source), so the agent sees src/actions/analytics.ts and src/app/users/page.tsx instead of the compiled server bundle, and logpoints work in pages, layouts, Route Handlers, and Server Actions. I wrote a small script that started the server, drove the browser through the bug, and uploaded the pair, which took 10–30 seconds per bug.
I did make one change to Nadia’s app. In a production build, Next prerenders /users at build time, so its redirect ran during next build and never ran in the server I was recording. I changed the page to render per request:
import { connection } from 'next/server';

export default async function UsersPage() {
  await connection();
  const user = await getUser();
  redirect(`/users/${user.id}`);
}
Nadia ran the app under next dev, which renders every page per request anyway, so this is closer to how the bug behaved for her. Two of the agents noticed the change, and pointed out that it also changes how the redirect gets delivered - it now streams inside the root loading.tsx boundary instead of coming back as a 307. That’s a good catch! But, the bug reproduced in my earlier recordings without the change as well, so it isn’t the cause.
A couple more setup notes. A server recording holds every request the server handled while it ran, so it’s easiest to record one scenario per server run. Also, next dev now works under Replay Node too, with source maps back to the original TypeScript, so you can record the same setup Nadia actually used. I ran these comparisons on production builds, because that’s what worked when I started.
Debugging a Server Recording With Agents
Most agent investigations start with the RecordingOverview tool, which is designed to give a summary of key info about a recording. For client recordings, that includes details on libraries, frameworks, network requests, and errors. When I started this work, the overview for a Node recording said almost nothing: “Node 16+ recording (no URL)”, the duration, and zero network requests. That’s technically true, since the server didn’t make any requests, but it doesn’t give the agent anything to work with.
After seeing these results in the first Node recordings, I rewrote the RecordingOverview tool to give meaningful details for Node. The Node overview now detects Next.js, lists every request the server handled with its route and kind, and lists the pages, layouts, Route Handlers, and Server Actions that ran, with call counts. The Replay Node 26 post shows the overview for the bug 3 server recording. Here’s the requests table for that same scenario after the fix:
| Method | Route | Count | Kind |
| --- | --- | --- | --- |
| POST | `/api/analytics` | 5 | route handler |
| GET | `/api/user` | 1 | route handler |
| GET | `/users` | 1 | page |
| GET | `/users/1` | 1 | page |
In the buggy run, the first row was POST /users, /users/1 - 5 - server action sendAnalyticsData. Comparing the two overviews, you can already see what the fix changed.
This ended up mattering more than anything I put in the prompt. More on that below.
Debugging Frontend and Backend Recordings Together
There’s no automatic link between a browser recording and a server recording. They’re two separate recordings, and every Replay MCP call takes one recording ID, so the agent has to line them up itself. (We’ve experimented with tooling that will automatically correlate paired frontend and backend recordings, but that’s just a prototype so far.)
The agents turned out to be good at this. There’s no shared request ID, so they matched events up by Server Action name and arguments, route, and order. For bug 2, one run added logpoints on the user page and on the /api/user handler in the server recording, and compared those with the browser’s network requests:
page.tsxran once (logpoint hit at 4472ms server time,id = "1"). The/api/userhandler ran about 890ms later (5360ms server time), as a separate request.
That’s the request waterfall, seen from the server’s side: the page renders without the user’s data, and then the browser has to ask for it in a second request after hydration.
Does the Server Recording Help?
For each bug, I recorded a fresh browser + server pair and ran the same prompt in four setups:
- Step 1: browser recording only, like April.
- Step 2: both recordings, with a short section in the prompt describing the server recording.
- Step 3: both recordings, with the prompt rewritten to explicitly ask the agent to check both sides.
- Step 4: the step 3 prompt, after we rewrote the Node overview.
All runs used Opus 5.5 with no web access, with two runs per setup (one for step 3). Each run was a fresh headless OpenCode v2.3.0 session with only Replay MCP, the app source, and a shell - no other config or memory carried over between runs. Grading used the same rubrics as April: 12 points for bug 2, 7 for bug 3.
| Bug | Setup | Runs | Grade | Time | Calls on the server recording |
|---|---|---|---|---|---|
| 2 | Browser only | 2 | 12/12, 12/12 | 1.6–2.1 min | – |
| 2 | Both | 2 | 12/12, 12/12 | 1.5–1.6 min | 4, 4 |
| 2 | Both, “check both sides” | 1 | 12/12 | 2.0 min | 3 |
| 2 | Both, new overview | 2 | 12/12, 12/12 | 2.0–2.4 min | 7, 6 |
| 3 | Browser only | 2 | 6.5/7, 7/7 | 1.7–2.9 min | – |
| 3 | Both | 2 | 6.5/7, 6.5/7 | 2.0 min | 1, 0 |
| 3 | Both, “check both sides” | 1 | 6.5/7 | 1.9 min | 1 |
| 3 | Both, new overview | 2 | 7/7, 6.5/7 | 2.1–2.9 min | 3, 2 |
I was surprised (and frankly rather disappointed) to see that for these bugs, adding the server recordings did not meaningfully improve the results! Across 14 runs, adding the server recording didn’t change grades, time, or cost in any way I could separate from normal run-to-run variation. Every run cost between $0.39 and $1.29.
That said, the main reason things didn’t get better is that there wasn’t any room to improve - the agents already sufficiently solved them from just the client recordings. Opus 5.5 already gets 12/12 on bug 2 from just the browser recording and the source. Both of these are client-side bugs, and the evidence that matters is in the browser.
What was interesting is how the agents used the server recording. On bug 2, they used it as a second, more direct piece of evidence for the waterfall. On bug 3, they used it to rule out the server quickly, often with a single logpoint:
users/page.tsxranredirectwithuser.id = 1at 9591 ms. About 540 ms later,sendAnalyticsData("root-layout")and then"users-layout"ran. Both returned{"a":"$undefined"}with no redirect and no error. The server side is not at fault.
So, adding the server recording did still act as useful evidence for these issues.
The half points lost on bug 3 don’t have anything to do with the server. Every run found the trigger and the fix, and showed the router state turning into a pending promise while the Server Actions were in flight, with the redirect landing in that window. But, none of the Opus 5.5 runs explained that the Server Action response carries RSC data that updates the router state during the redirect. (Opus 5.0 did get that in one of my baseline runs.) That’s all client-side router code, so the server recording can’t help there.
The Overview Mattered More Than the Prompt
I tried including specific instructions in the step 3 prompts to tell the agent to look at both sides. Compared with step 2, it made no measurable difference.
The rewritten RecordingOverview tool did help. With the old overview, agents made 0–4 calls on the server recording. With the new one, the bug 2 runs made 6–7, and one of them found a detail no earlier run had reported: the hover prefetch of the user page only loaded the loading.tsx shell, which is why that skeleton shows up instantly on click.
Agents start from what the overview shows them. If the overview says a recording has nothing interesting in it, the agent believes it, no matter what the prompt says. That’s a useful lesson for how we design the Replay MCP tools.
A Bug on the Server Side
Bugs 2 and 3 live in the browser. I wanted to see what the server recording does for a bug that actually lives on the server, so I planted one in a copy of Nadia’s app.
I changed one customer name from Innovate Ltd to Innovate Ltd., and changed the mock data’s email builder to replace punctuation with dots. That produces innovate.ltd.@example.com, which zod’s email validation rejects. When you click one of that customer’s orders, the order API route throws during validation and returns a generic 500 {"error":"Failed to fetch order"}. The client then parses the error body as an order, gets a second (and misleading) validation error, retries three times, and shows “Order not found”. The order still shows up in the orders table, because the list endpoint validates with a schema that has no email field.
The bug report only described what the user saw: some orders show “Order not found”, and here’s one of them. Two runs got only the browser recording, and two got both.
All four runs scored 7/7, in about a minute each, and reached the same diagnosis and the same fix. The difference was in how they got there.
The browser-only runs reasoned from the 500 status: a 500 instead of a 404 means the server found the order and something after that threw, so it was probably the schema validation. Then they found the bad email by running code outside the recording. One wrote a script that generated orders 1–100 with the app’s mock data function and validated each one. Both runs said clearly that this part was inferred:
server code isn’t captured in the recording, so the specific email failure comes from reproducing it locally
The runs with both recordings read the server’s console.error output (four ZodErrors on customerEmail), then added a logpoint on the validation line in the route, which returned ord-72 | ORD-000072 | Innovate Ltd. | innovate.ltd.@example.com for every request. One run counted hits on each branch of the route handler: order lookup 4, the 404 branch 0, validation 4, success 0, catch 4. They listed the server error and the bad value as proven by the recordings, not inferred.
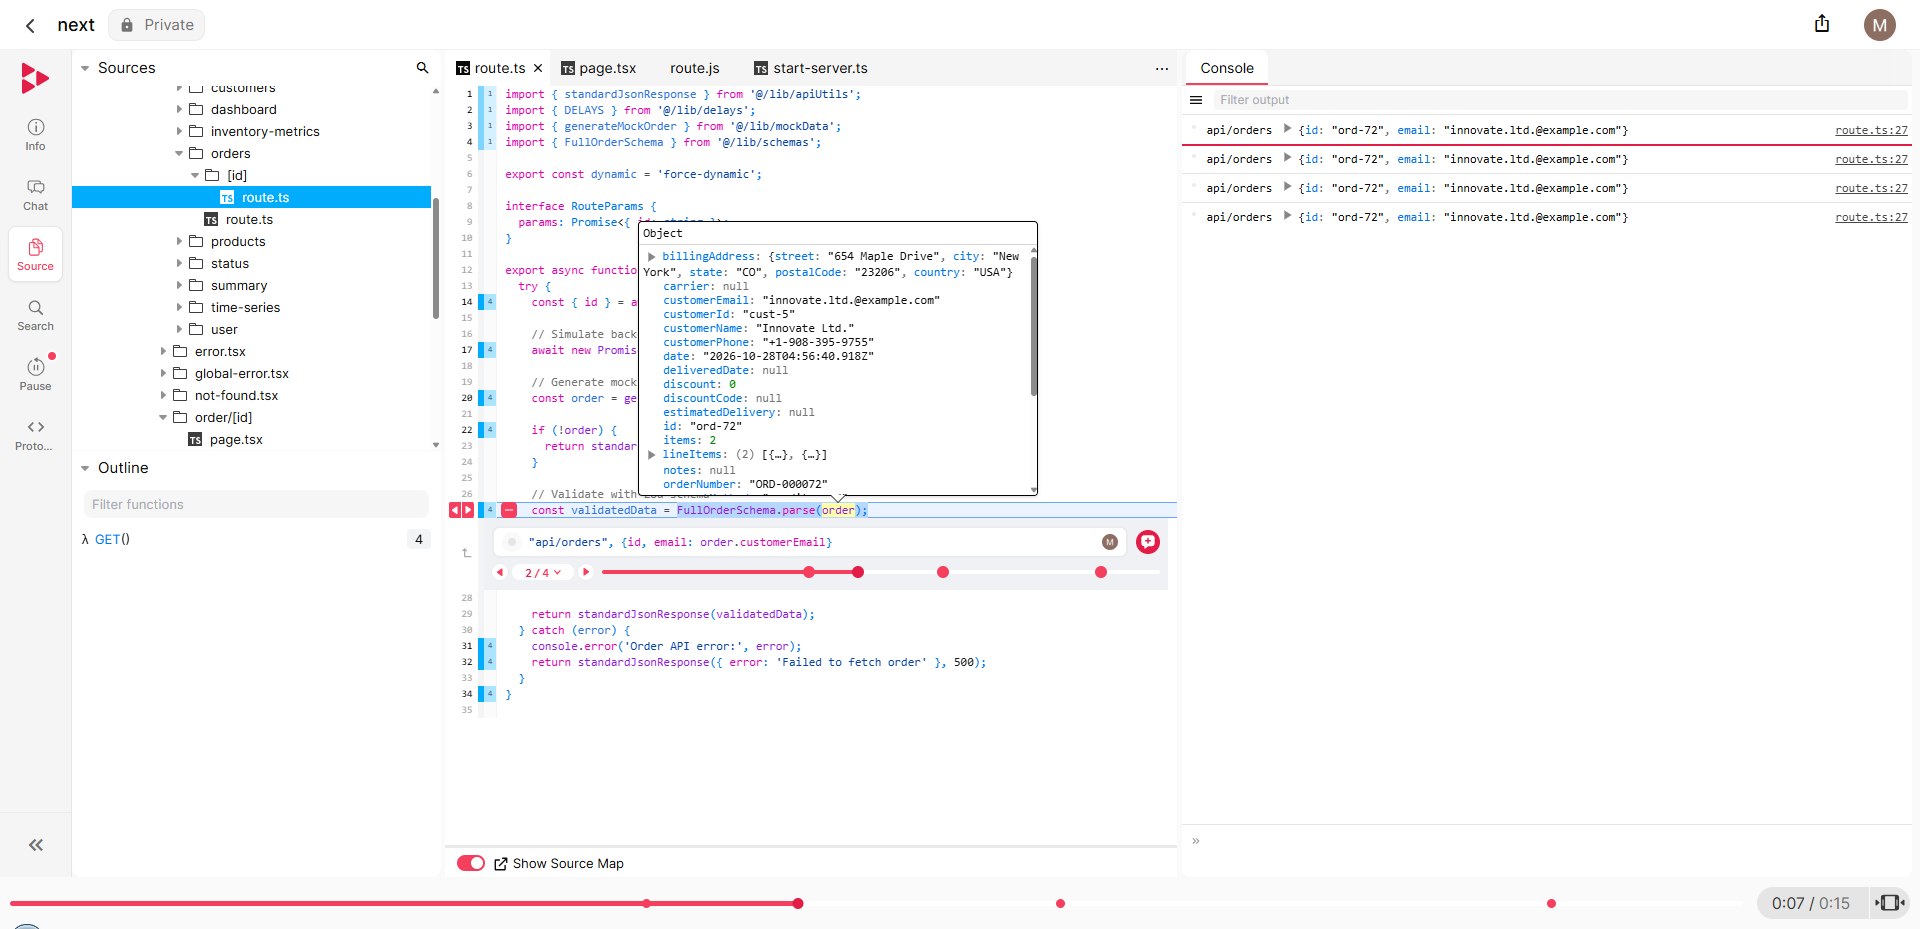
Here’s the same thing in Replay DevTools. The print statement on the validation line shows the same bad email for all four requests, and the gutter shows the hit counts: the 404 and success lines never ran, and the catch block ran four times.
The grades matched because my planted bug was easy to reproduce locally: the orders come from a seeded generator in the repo. In a real app, that data would come from a database, another service, or state that only exists in production. A browser-only agent would have to stop at “the server threw somewhere in validation”. An agent with the server recording can still read the actual value from the request the user made.
After the Fix: Checking Both Sides
For bugs 2 and 3, I applied the fixes the agents proposed and recorded a new browser + server pair for each. (Every agent proposed the same fixes.)
Bug 2: prefetch the user on the server with TanStack Query’s prefetchQuery, pass it down through a HydrationBoundary, and switch the page to useSuspenseQuery. After the fix, the browser recording shows no skeleton at all and no /api/user request. The server recording shows prefetchQuery running once in users/[id]/page.tsx and calling getUser(), and the /api/user handler never running. The server overview has the same rows as before the fix, minus /api/user.
Bug 3: stop sending analytics through a Server Action. Next sends Server Actions through the same router queue it uses for navigations, so while one is in flight, the router is waiting on it. An analytics call doesn’t need the router at all. The fix moves it to a Route Handler called with fetch(..., { keepalive: true }). After the fix, loading /users redirects cleanly with no error and no console messages. The server recording shows the Server Action module is gone, and the new /api/analytics handler ran five times with the same names as before.
Neither of these checks is possible with just the browser recording. “The UI looks right” is good evidence. “The UI looks right, and the server did exactly what the fix said it would” is much better. That’s the same idea behind our self-healing loop experiment, where 80 of the 152 PRs it opened were merged with a recording that showed the bug reproduced and then showed it gone. Recording the backend adds the server side to that check.
Lessons Learned
I did try to do some reasonably-scientific experiments here: change one variable at a time, measure the results. That said, this is still a pretty limited set of results. One model, a couple runs, one example app, and just running checks on my own machine and harness. But, these are still some useful data points and we can draw some conclusions.
We’ve proven that:
- Replay Node 26 can record a Next.js server in both production and development builds
- The server-side recordings can be analyzed via Replay MCP, including sourcemaps, Node overview details, and insights into Next.js request traffic
- Agents can successfully pair up frontend and backend recordings just by comparing request sequences and reason about the behaviors
- Server recordings can be used to debug and verify server-side issues, behavior, and fixes
Strictly speaking, this particular set of example bugs doesn’t help us prove that having a server recording improves diagnosing bugs. We’d really need some deeper bugs that involve more difficult server issues to demonstrate that. But, given how much we’ve seen that having a client-side recording enables successful root cause analysis, I’m quite comfortable saying that having a server-side recording makes that even better too :)
More Examples: Brian’s Demo Site
Nadia’s app is small, and the client does most of the interesting work. Our CEO Brian Hackett has been working with an app that leans the other way, which he showed in his video on full-stack debugging.
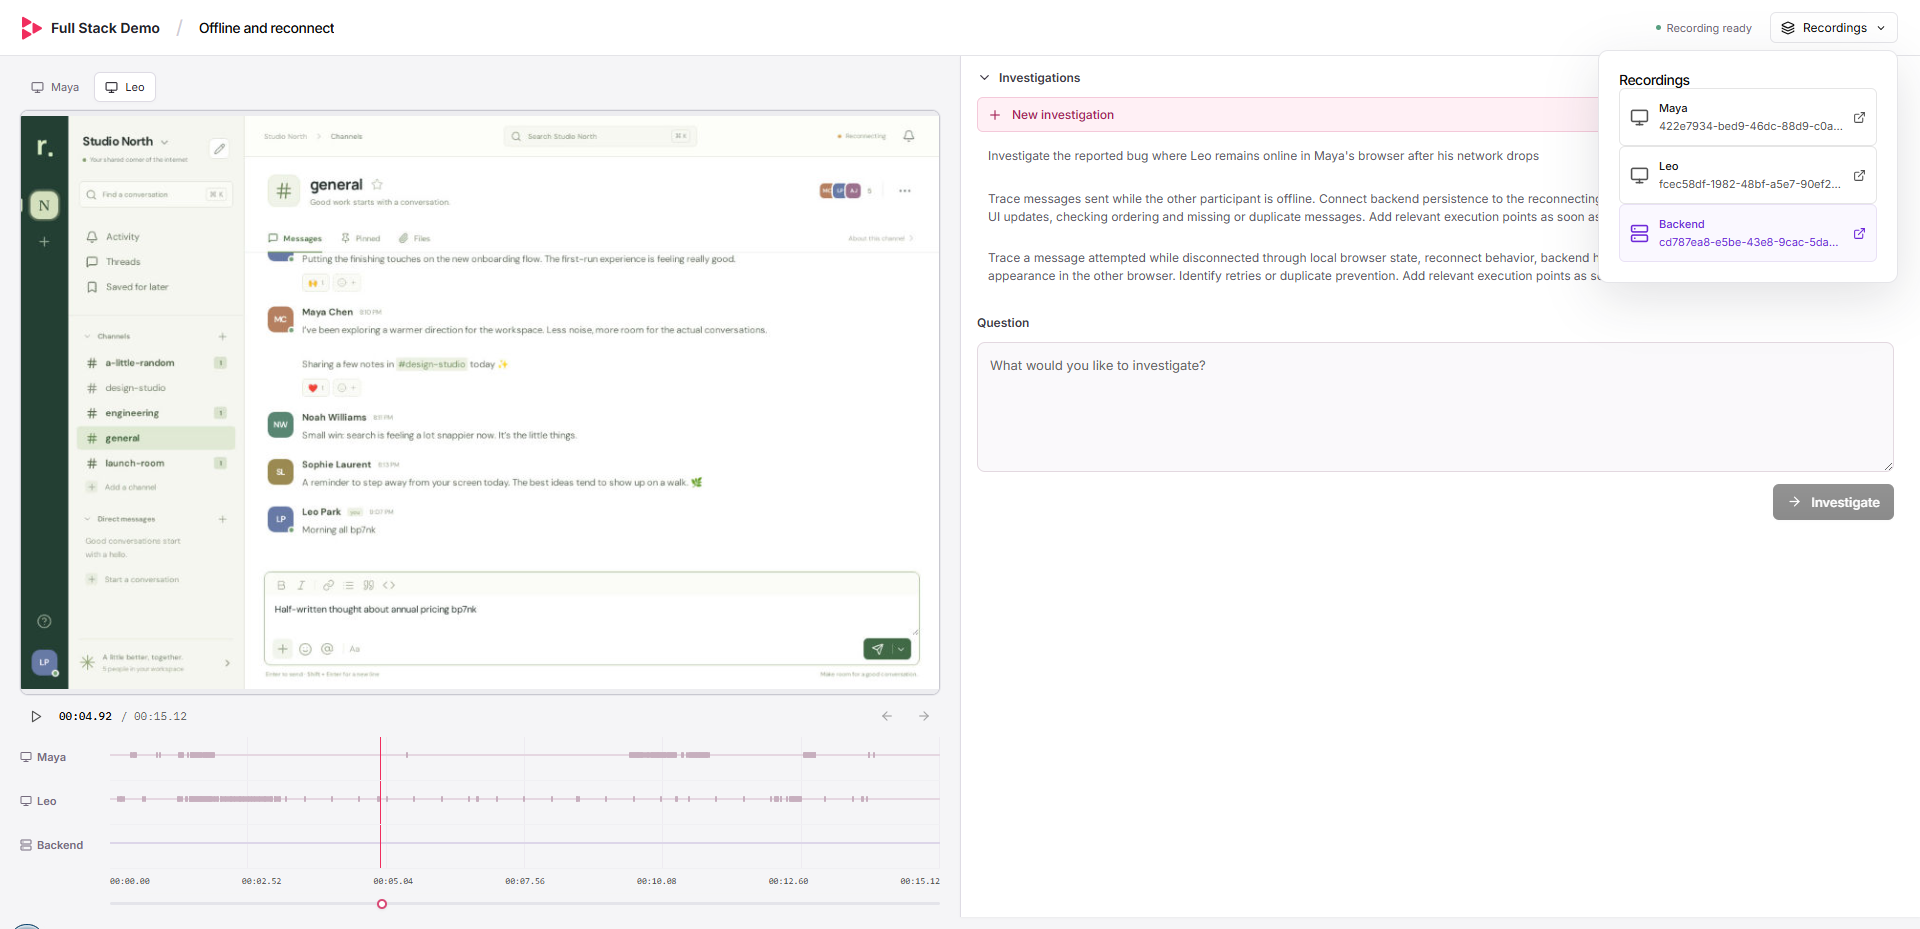
It’s a Slack-style chat app called Relay Chat, written by Astra. The demo site at full-stack-demo.replay.io has 11 scenarios, like private channel secrecy, offline and reconnect, and editing and deletion races. Each one has two to five browser recordings (one per user) plus a recording of the backend, and you can start an investigation on any of them.
The bug in Brian’s video lives on the server. When one user disconnects, the server broadcasts the online user list without filtering out the user who just left, so everyone else’s UI keeps showing them as online. The symptom shows up in every browser recording, but the cause is only in the backend.
The backend in that demo runs on workerd, the runtime behind Cloudflare Workers. We’re experimenting with recording it, and the Replay MCP overview already recognizes it, but that work is experimental and separate from Replay Node.
What’s Available Today
That’s a lot of moving pieces! For clarity, here’s what’s available today, vs what’s still a proof of concept or prototype:
- Available: Replay Node on Node 26 for Linux x86-64. You can record any Node script or server, including a Next.js server with
next startornext dev.- Replay Node 26 does not currently support macOS or Windows
- Available: Replay MCP works on both browser and Node recordings, and the Node overview summarizes Next.js requests and entry points. Give an agent both recording IDs and it can investigate each one and line them up.
- Experimental / POC: recording
workerdbackends or automatically correlating browser and server recordings- Currently an agent would need both recording IDs and have to do the correlation itself
What’s Next
Recording a Node server works today, but you still have to do the setup and recording process yourself: start the server under Replay Node, record the browser, upload both, and tell the agent which recording is which. We want to make that a single step. The server overview also doesn’t yet give per-request times or show that a page ended in a redirect, and both of those would save agents a few calls.
We also need harder bugs! If you have a Node backend on Linux and a bug that crosses the line between browser and server - especially one that depends on data you can’t easily recreate - try recording both sides and handing them to your agent. Let us know how it goes in Discord, especially if it doesn’t work.